The History and Science of Surf Reporting and Forecasting on Oahu
Share
The History and Science of Surf Reporting and Forecasting on Oahu

All of those who surf and live in Hawaii have become accustomed to daily surf reports and forecasts, but many of us are unaware of the science and history that go into those reports. This information is not only interesting for us from a cultural perspective, but also useful in better understanding the ocean and swells, which in turn makes us better watermen and women.
The original surf reports were anecdotal observations from surfers and other coastal people. In 1968, a man named Larry Goddard began keeping written records of observed waves heights on the north shore of Oahu, and four years later he added the south shore to his report as well. These observations were taken at standout spots that tend to receive the most size in the region, such as Sunset Beach and Ala Moana. They used the Hawaiian scale and logged what was called the H1/10, or the average 10 percent highest waves for the day.
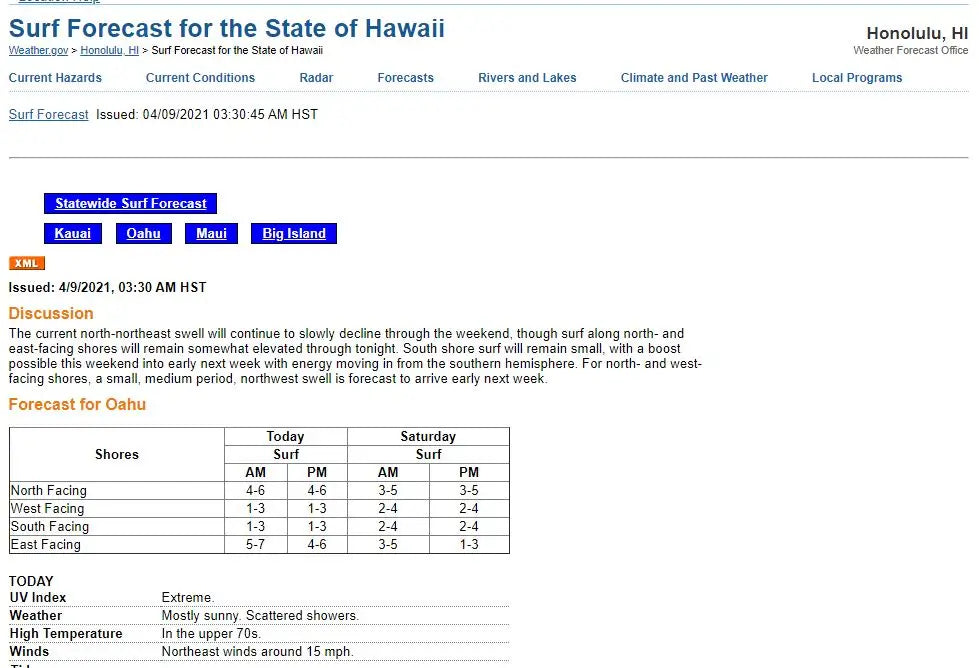
In 1987, Mr. Goddard moved away from Hawaii to the Mainland. But fortunately, that same year, Pat Caldwell began keeping his own written record of wave heights on Oahu. Caldwell would go onto become the preeminent name in Hawaiian surf forecasting and surf climatology, holding an enviable job (for those who geek out on surf heights) as an oceanographer with NOAA and it’s National Weather Service, specializing in surf reports (among other things) for the state of Hawaii.
When Mr. Goddard returned to Hawaii in the late 1990s, he shared his collection of observations with Pat Caldwell, effectively creating a repository of daily surf reports for Oahu dates from 1968 through to the present time. This data was the subject of a research paper confirming the validity of the numbers to within a 15% error of margin, and Caldwell eventually converted the observation records from Hawaiian scale to wave face measurements (by using the formula of Hawaiian scale x 2 equals face measurement). The combined data collected by the two men has been the subject of various research projects, and is known as the Goddard-Caldwell Database.
If you look at the data collected over the years and apply averages and means to it, you will find that the average waves during the North Shore season are 12 feet, plus or minus 8, which means that on average the waves range from 4-20 feet on the face during the winter on the North Shore. Of course there are days that lie outside of that range (including some very memorable XXL days each winter), but generally speaking the average. The Goddard-Caldwell Database also shows that more northerly swells are common in fall and spring, whereas winter swells (January through March) tend to be of a more westerly and northwesterly direction. This is due to the behavior of the Jetstream during these seasons.
The south shore of Oahu sees lower average numbers as south swells come from storms that are farther away from Hawaii, and therefore suffer from more swell decay. When averaging over the mean, median, and mode for the south shore season, which stretches from March through October, we find that the swell size averages 5.5 feet (on the face), plus or minus 2.3 feet. Thus, the average daily swell height (at Ala Moana, which tends to pick up the most swell on the south shore) ranges from 3-8 feet on the face.
The Goddard-Caldwell Database also began measuring swell on the east side in 1987, first at North Beach on Kaneohe Marine Corps Base, and then at Makapuu. The data shows a bit of variability in east coast measurements, largely due to the variety of swells that can filter into the east-facing shore (trade wind swells, north swells, etc.) and the fact that different places are shadowed from different swells. However, the data agrees that the average annual trade wind speed measured on the east side (which is the direction that the trades come from) is 16 mph. The assumed average trade wind swell height for the east side is 5 feet on the face.
So what does all of this mean for the average surfer? Well, that depends how much personal involvement you like to have in your surf forecasting. If you are content to simply let Pat Caldwell tell you how big the waves are every morning, he is happy to do so—and has been since the late 1980s. But for those who like to keep their own observations and forecasts, it is helpful to understand the seasonal averages of swell heights on the various coasts, so you always have your quiver updated and ready when new swells hit!
More to Read...
